State results through November 3, 2026 (2026 general election, semi-official returns)Precinct results through June 2, 2026 (2026 Primary Election; 55 of 58 counties posted)
Capitol Daybook Research · District Profile · Model
Assembly District 5 covers El Dorado, Placer. Seat status: Incumbent re-elected, Nov 2026. The 2028 rating is Likely R; the district lean is Likely R.
California State Assembly · 2021 Lines
Assembly District 5
Seat status: Incumbent re-elected, Nov 2026
2028 rating: Likely R · District lean: Likely R · Why this rating
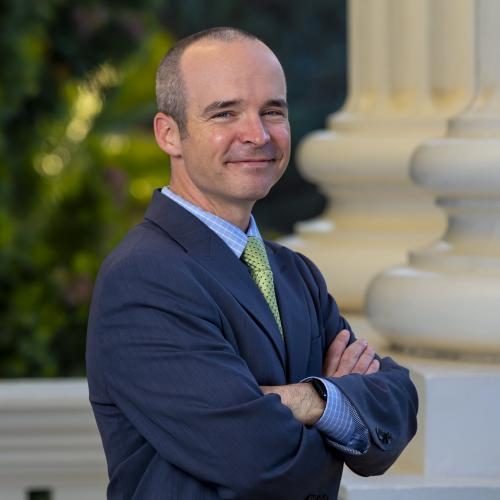
Joe Patterson (Republican) was re-elected on November 3, 2026.
Joe Patterson was first elected to the California State Assembly in 2022. He lives in Rocklin. Before the Assembly, he served on the Rocklin City Council from 2016 to 2022 and was mayor in 2019. His earlier career was in Sacramento politics: he worked as a Capitol staffer, served as Executive Director of the Lincoln Club of Northern California from 2011 to 2014, and was Executive Director of the California Gaming Association from 2014 to 2019. He earned a B.A. in government from California State University, Sacramento, and entered the Capitol through the Jesse M. Unruh Assembly Fellowship.
DistrictAssembly District 5
At a glance
- 2028 rating: Likely R
- 2026 result: Joe Patterson 57.0% to 43.0% · margin 14.0 pts (called, semi-official returns)
- Latest change: Filing recorded · November 4, 2026
The 2028 Assembly race
Likely R
District lean Likely R (score -11.2)
Registration edge
R+11.3
369,970 registered voters · October 19, 2026 report
President 2024
R+11.0
was R+13.4 in 2020
Turnout, 2024 general
82.7%
of registered voters (district-file registration count)
Capitol Daybook Research rates the 2028 race for this seat Likely R. The full assessment is in the Overview tab.
At a glance
Likely R
R+11.3
R+11.0
2028
- More of the vote is being cast in close precincts: 28.7% of the 2024 presidential vote was cast in precincts decided by five points or less.
Analyst assessment
The bottom lineAnalytical inference
Capitol Daybook Research rates the 2028 race for this seat Likely R. The district lean is Likely R (score -11.2): the 2024 presidential vote on these lines ran R+11.0 and voter registration runs R+11.5 (September 4, 2026 Report of Registration, the lean's registration input). Since 2016 the presidential margin has moved 6.5 points toward the Democrats, from R+17.5 to R+11.0; in 2024, 28.7% of the two-party vote was cast in precincts decided by five points or less. Joe Patterson holds the seat.
Office contacts
Capitol office: Suite 4530, 1021 O Street, Sacramento, CA 95814-4900 · (916) 319-2005
District office: 6030 West Oaks Boulevard, Suite 145, Rocklin, CA 95765 · (916) 435-0501
Key contacts: Scheduler: Christina Paxton
Analyst assessment
Assessment in depthAnalytical inference
Current position
The district lean is Likely R (score -11.2): the 2024 presidential vote on these lines ran R+11.0 and voter registration runs R+11.5 (September 4, 2026 Report of Registration, the lean's registration input). The rating for the 2028 race is Likely R. Joe Patterson holds the seat.
Potential vulnerability
In 2024, 28.7% of the two-party presidential vote was cast in precincts decided by five points or less. The presidential margin has moved 6.5 points toward the Democrats since 2016, from R+17.5 to R+11.0.
What cuts the other way
The 2024 presidential margin itself was R+11.0, a wide margin by any standard. Voter registration has not followed the presidential vote: the Republican share of registered voters is essentially unchanged across the reports on file, from 41.88% to 41.6%.
What to watch
- Whether the close-precinct share holds in the 2026 precinct returns when they are published.
- Whether the presidential margin keeps moving toward the Democrats when the 2026 precinct returns are published.
- The June 2028 primary field, which sets the general-election matchup.
Free sample
This district's complete profile is open to everyone as a free sample, with the finance figures, candidate records and data layers in full.
About this district
The 5th Assembly District covers parts of two counties, El Dorado and Placer. Its principal communities, as listed in the district record, are Auburn, Lincoln, Rocklin, Roseville, El Dorado Hills, Cameron Park, Placerville and Folsom. Rocklin appears in the record both as a principal community and as the home city of the incumbent, Assemblymember Joe Patterson.
The district has 369,970 registered voters. Republicans account for 41.6 percent of registration, Democrats for 30.3 percent, and voters registered with another party or with no party preference for 28.1 percent. The registration margin is R+11.3. Across the ten Secretary of State reports in the trend file, from September 6, 2024 to October 19, 2026, total registration rose from 354,035 to 369,970. The Republican share moved from 41.88 percent to 41.6 percent, the Democratic share eased from 30.91 percent to 30.26 percent, and the other share rose from 27.21 percent to 28.14 percent.
The 2024 presidential vote, computed on the current district lines, ran ahead of the Republican registration share. Donald Trump received 157,756 votes, 53.92 percent of the district total. Kamala Harris received 126,399 votes, 43.2 percent, and the other ballot listed candidates received 8,428 votes combined.
The contribution record in the district centres on the incumbent. The largest contributions listed for Patterson include $23,600 from the California Association of Realtors political action committee, $23,600 from the North Coast States Regional Council of Carpenters POWER PAC, and $12,500 from the CAL FIRE Local 2881 Small Contributor PAC. Independent expenditure support in the district is recorded separately in the race analysis below.
Outlook
District lean: Likely RCalculated finding
2028 rating: Likely RAnalytical inference
The seat's incumbent is Joe Patterson (R). The district voted for the Republican presidential ticket by 11 points in 2024, with a 12-point Republican lead on the registration rolls. The field was empty at the rating date, so the rating is the structure's: a presidential margin of 11 points and a 12-point registration edge for Republicans.
Districts most like this one
Assembly District 71 · lean Likely R (R+11.0) · 2028 rating Likely R
Assembly District 63 · lean Likely R (R+10.9) · 2028 rating Likely R
Assembly District 75 · lean Likely R (R+13.5) · 2028 rating Likely R
What changed
Activity in the last 90 days: 2 filings recorded, 0 finance updates. Research access shows each event and its evidence.
Capitol Daybook Research
Research access
The full district files are available to Capitol Daybook Research clients. A Capitol Daybook subscription does not include research access.
The full district file carries registration trends across the recent Secretary of State reports, 2024 presidential results computed on the current district lines, 2026 campaign finance totals with independent expenditures, and CSV downloads of the district tables.
Covered by the published guarantee: material filings reflected within one business day, and corrections kept in a public log.
Election results
The 2026 result
2026 general election: Joe Patterson (Republican) won this seat. The incumbent was re-elected.
| Candidate | Votes | Share |
|---|---|---|
| Joe Patterson (Republican) | 133,759 | 57.0% |
| Neva Parker (Democratic) | 100,923 | 43.0% |
Results grid
2026 Primary Election: top finisher Joe Patterson (REP) with 60.1% (2021 lines).
2024 General Election: top finisher Joe Patterson (REP) with 62.0% (2021 lines).
2024 Primary Election: top finisher Joe Patterson (REP) with 58.2% (2021 lines).
2022 General Election: top finisher Joe Patterson (REP) with 60.2% (2021 lines).
Competitive precincts
How this district voted locally
2024 ballot measures in this district
How this is calculated
Candidates
Race brief: every candidate's money side by side
2026 candidates
Joe Patterson (Republican)
Neva Parker (Democratic)
2028 candidates
Candidate intelligence
The money
The money in context
Registration
Current registration
Turnout history
Geography
Counties: El Dorado (partial), Placer (partial)
Principal cities and communities:
Share of the district's registered voters, by county:
| County | Registered voters | Share |
|---|---|---|
| Placer | 270,277 | 73.05% |
| El Dorado | 99,693 | 26.95% |
31 ZIP codes in this district

Sources and methods
| Election results | Statewide Database precinct files, validated against the Secretary of State's certified Statement of Vote. The 2026 result and race status come from the district record, which is the single source every section of this profile uses. |
|---|---|
| Registration | California Secretary of State, Report of Registration (latest report in the trend table). Ethnic composition is a surname-analysis estimate; California does not record ethnicity at registration. |
| Campaign finance | Money data: California campaign filings through October 17, 2026 (Cal-Access) and federal candidate filings through October 15, 2026 (FEC), with the FEC independent expenditure file dated November 1, 2026, as compiled in the district finance records. Burn rate means spending divided by starting cash plus money raised this cycle. Where a candidate's figures combine more than one committee or cycle, the card says so, and combined figures are never presented as a burn rate. Totals combine a candidate's committees across every cycle they cover; the finance table names each committee. |
| Demographics | U.S. Census Bureau, American Community Survey and the citizen voting-age population tabulation. Population, eligible electorate, registered voters and actual voters are different populations and are never interchanged. |
| Geography | Boundaries: 2021 lines throughout. |
| Local results | Statewide Database local files, 2022 forward, re-cut to this district from the precincts' district assignments (2021 lines, the current state lines). County-race shares on this profile are of the votes cast inside the district, not the full contest. |
| Ratings | The district lean is calculated: 0.7 times the 2024 presidential two-party margin plus 0.3 times the registration gap. Race ratings are analytical inferences with a written rationale and an as-of date, on the Outlook card. Full method: Methodology. |
Continue
Seat history in the Candidate Archive · every run for this seat since 2014.
Full 2024 result · the Election Reports precinct record.
Ask the Desk about this district · the Research Desk answers from the same record.
Race Ratings board · All district profiles · The report library
Connected record
People with books
Committees in this race
Planned Parenthood Affiliates of California VOTES PAC
California Teachers Association/Association For Better Citizenship
Local contests
El Dorado Union HSD School Board Member (2022 General Election)
Placer County Sheriff-Coroner-Marshall (2022 Primary Election)
Placer County Clerk-Recorder-Registrar (2022 Primary Election)